An image histogram represents the spread of the pixel values of a digital image. For a gray scale image (bit depth = 8bits ) , each pixel can have a brightness value from 0 for black and 255 for white. The histogram is a count of how many pixels are at each brightness value.

http://www.cambridgeincolour.com/tutorials/histograms1.htm
When the histogram is normalized by the total number of pixels we have the probability distribution function. From the pdf we can obtain the cumulative distribution function or the cdf.
In this activity, our aim is to improve the contrast of an image by remapping pixel values of the old cdf so that the resulting cdf will have the desired pdf. Step by step this is how it is done.
- For each pixel value …
- find the original cdf value.
- Trace this original cdf value in the desired cdf.
- Replace the original pixel value with the pixel value that will give the same probability in the desired cdf graph
Here are some of my results.
For a desired uniform distribution pdf the cdf is a straight line.
This is the original image...
http://www.janellegreenwood.com/images/grayscale.jpg
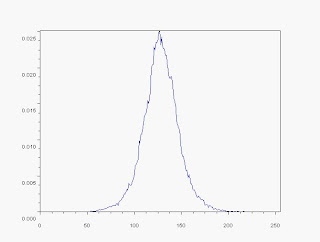
and the original PDF...

and the original cdf.
 Notice that most of the pixel values are in the middle tones and that no very bright or very dark values exist. This is a very poor contrast image. However after a remapping of the pixel values...
The image now has whites and blacks instead of just middle grays.
In fact, the pdf shows that the range of pixel values now extend to all the possible levels. A check of the new cdf reveals that it is indeed linear.
New PDF

 Notice that most of the pixel values are in the middle tones and that no very bright or very dark values exist. This is a very poor contrast image. However after a remapping of the pixel values...
Here is the contrast enhanced image.
In fact, the pdf shows that the range of pixel values now extend to all the possible levels. A check of the new cdf reveals that it is indeed linear.
New PDF


New CDF

Here are the results for the other images.
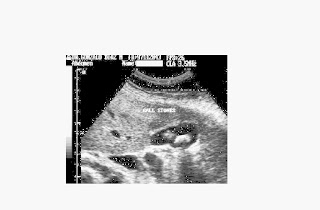
Before and After


http://www.drgdiaz.com/pat/gallstones.shtml


http://www.american-indian-artwork.com/restoration/grayscale-picture-650.jpg
http://www.american-indian-artwork.com/restoration/grayscale-photograph.jpg
Now notice that for some of the enhanced images there are parts that looked rather saturated and noisy. This happens especially for images with a limited range of pixel values because the algorithm forces the image histograms to stretch over the entire range of pixel values. A solution to this is to remap only on the original histogram range.
Another way is to find another cdf that suits the image better.
Using a parabolic function (positive half only) I got a better result for the image of the lady.
For this activity, I give myself a grade of 10. I was able to do image enhancement and I fully understood the activity.
Another way is to find another cdf that suits the image better.
Using a parabolic function (positive half only) I got a better result for the image of the lady.
For this activity, I give myself a grade of 10. I was able to do image enhancement and I fully understood the activity.


No comments:
Post a Comment